Chainer で Deep Learning: Bokeh で Live Monitoring したい
概要
Deep Learning の学習には時間がかかるため、進捗が都度 確認できるとうれしい。その際、テキストのログ出力では味気ないので、リアルタイムでプロットを眺めたい。
いくつかの Deep Learning パッケージではそういった機能 (Live Monitoring) が提供されている。
- Undefined Intelligence: Monitoring Experiments in Pylearn2
- Live plotting — Blocks 0.0.1 documentation
- fchollet/hualos · GitHub
同じことを Chainer でやりたい。自分は EC2 を使うことが多いので、リモート環境でも利用できるものがいい。そのため、ここでは Bokeh を使うことにした。
Bokeh とは
Bokeh とは、D3.js を利用したブラウザベースのインタラクティブな可視化を実現するパッケージ。どんなものかは公式の Gallery が充実しているのでそちらを。
補足 R 用のパッケージ {rbokeh} もある。
インストール
pip で。
$ pip install bokeh
準備
環境は EC2 上に作成する。Bokeh からは、ファイル、IPython、Bokeh 組み込みのWebサーバ ( bokeh-server ) 上の画面 の 3種類に対して出力することができるが、今回は Ipython を使うことにする。
補足 もっとも、常に IPython を使うわけではないため、 bokeh-server 上でも描画できるようにしたい。少し試したが、EC2 上に Bokeh を置くと bokeh-server の画面は開くが個々のプロットが表示できなかったため諦めた (ローカルでは問題ない)。できた方いたらやり方教えてください。
bokeh-server はプロットの描画画面だけでなく、動的なデータ更新のためのAPIも提供している。この例では 学習の進捗をリアルタイムで描画するために bokeh-server の機能を利用する。bokeh-server はシェルから以下のコマンドで起動できる。このとき、外部からの接続を受け入れるには自身のホスト名 / IP を引数 ip として指定する。
$ bokeh-server --ip=ec2-xxx-xxx-xxx-xxx.ap-northeast-1.compute.amazonaws.com
補足 EC2 では (特に設定していなければ) グローバル/プライベートの IP が異なるため、IP 指定では正しくデータが更新されないようだ。そのため、パブリックDNSを指定した。
Live Monitoring
以降は IPython Notebook から。Live Monitoring のためのプロットを行うクラスを定義する。
import numpy as np
import chainer

import bokeh.plotting as plotting
from bokeh.models import GlyphRenderer


class LiveMonitor(object):

    def __init__(self, server='chainer', url='http://localhost:5006/', **kwargs):
        # 出力先に IPython Notebook を指定
        plotting.output_notebook(url=url)

        # トレーニング/テストデータの loss, accuracy を描画する figure を定義
        self.train_loss = self._initialize_figure(title='Train loss', color='#FF0000', **kwargs)
        self.train_acc = self._initialize_figure(title='Train accuracy', color='#0000FF', **kwargs)
        self.test_loss = self._initialize_figure(title='Test loss',  color='#FF0000', **kwargs)
        self.test_acc = self._initialize_figure(title='Test accuracy', color='#0000FF', **kwargs)

        # figure を 2 x 2 のグリッド (サブプロット) として配置
        self.grid = plotting.gridplot([[self.train_loss, self.test_loss],
                                       [self.train_acc, self.test_acc]])

        # グリッドを描画
        plotting.show(self.grid)

    def _initialize_figure(self, color=None, line_width=2,
                           title=None, title_text_font_size='9pt',
                           plot_width=380, plot_height=280):
        """ figure の初期化用のメソッド"""

        figure = plotting.figure(title=title, title_text_font_size=title_text_font_size,
                                 plot_width=plot_width, plot_height=plot_height)

        # 空のデータで折れ線グラフを作成
        x = np.array([])
        y = np.array([])
        figure.line(x, y, color=color, line_width=line_width)
        return figure

    def update(self, train_loss=None, train_accuracy=None,
               test_loss=None, test_accuracy=None):
        """
        プロットを更新するためのメソッド
        指定したキーワード引数に対応する figure が更新される
        """
        self._maybe_update(self.train_loss, train_loss)
        self._maybe_update(self.train_acc, train_accuracy)
        self._maybe_update(self.test_loss, test_loss)
        self._maybe_update(self.test_acc, test_accuracy)

    def _maybe_update(self, figure, value):
        """ figure の値を更新するメソッド"""

        if value is not None:

            # Variable から np.array に戻す
            if isinstance(value, chainer.Variable):
                value = chainer.cuda.to_cpu(value.data)

            # figure が利用している data_source を取得
            renderer = figure.select(dict(type=GlyphRenderer))
            ds = renderer[0].data_source

            # data_source 中の値を更新
            y = np.append(ds.data['y'], value)
            ds.data['y'] = y
            ds.data['x'] = np.arange(len(y))

            # session へ返す (とプロットが更新される)
            plotting.cursession().store_objects(ds)
このクラスをインスタンスにする。URL としては、bokeh-server の起動時に指定したものを 以下 URL の形式で指定する。
monitor = LiveMonitor(url="http://ec2-xxx-xxx-xxx-xxx.ap-northeast-1.compute.amazonaws.com:5006/")
あとは 学習 / テスト中に、monitor.update に適当な引数を渡せばよい。chainer/examples/mnist/train_mnist.py を例にすると、
# ... 略
        optimizer.zero_grads()
        loss, acc = forward(x_batch, y_batch)
        loss.backward()
        optimizer.update()

        monitor.update(train_loss=loss, train_accuracy=acc)

# ... 略

        loss, acc = forward(x_batch, y_batch, train=False)
        monitor.update(test_loss=loss, test_accuracy=acc)
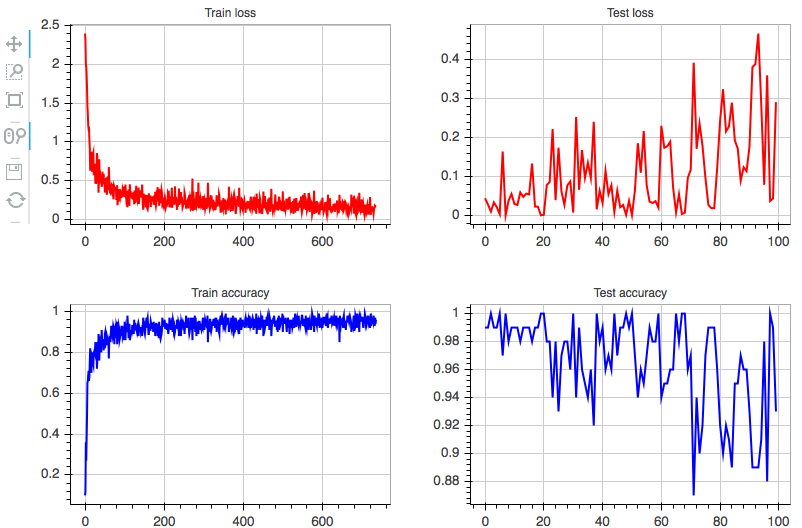
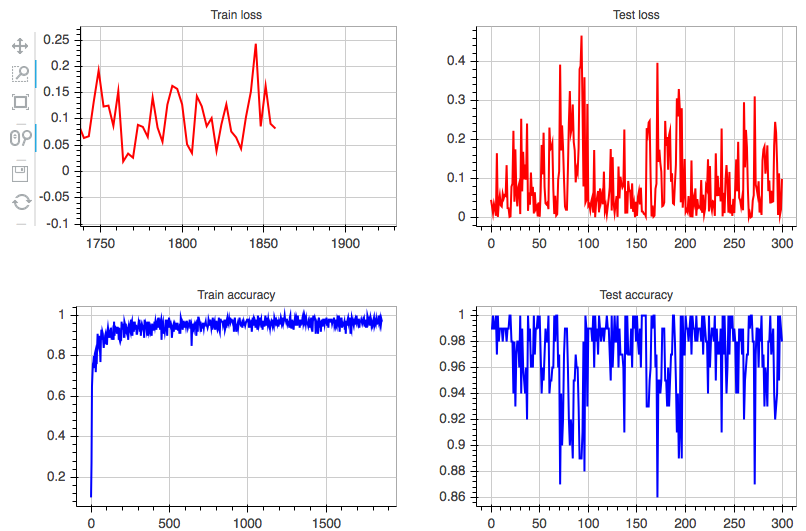
IPython 上 ( LiveMonitor インスタンスを作成した直後) のセルに、以下のようなプロットが表示される。プロットは update が呼ばれるたびに更新される。

また、各プロットはインタラクティブにズーム/パンといった操作ができる (左上)。

まとめ
これでリアルタイムに進捗を眺めて楽しむことができる。

- 作者: 岡谷貴之
- 出版社/メーカー: 講談社
- 発売日: 2015/04/08
- メディア: 単行本(ソフトカバー)
- この商品を含むブログ (4件) を見る