PyStan で「StanとRでベイズ統計モデリング」11.3節
著者の松浦さんから「StanとRでベイズ統計モデリング」をいただきました。ありがとうございます!
書籍では Stan の R バインディングである RStan を利用していますが、Stan には Python 用の PyStan もあります。松浦さんが書籍 5.1節の PyStan での実行例を書かれています。
補足 PyStan については過去にも書いた内容があります。
同じように、「StanとRでベイズ統計モデリング」の内容を Python で実施してみました。
11.3 ゼロ過剰ポアソン分布
以降、書籍 "11.3節 ゼロ過剰ポアソン分布" の流れに沿って Python のスクリプトを記載します。ロジックや処理自体の説明は書籍をご参照ください。データと Stan のスクリプトは GitHub上の StanとRでベイズ統計モデリング サポートページ から取得できます。
ゼロ過剰ポアソン分布とは: ポアソン分布と比べ、ゼロの割合が多い分布。ベルヌーイ分布 x ポアソン分布の混合分布としてモデル化できる。
import os

import numpy as np
import pandas as pd

import matplotlib.pyplot as plt
import seaborn as sns

pd.__version__
# '0.19.0'

sns.__version__
# '0.7.1'
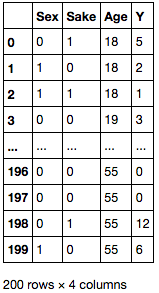
ダウンロードしたデータを読み込みます。
df = pd.read_csv(os.path.join('input', 'data-ZIP.txt'))
df
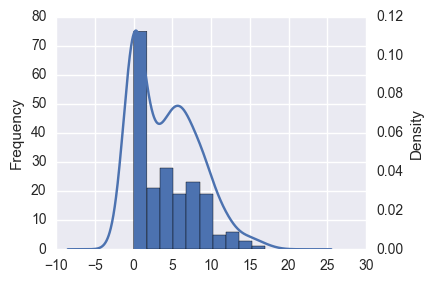
Y 列の分布を確認すると、0 が多く含まれていることがわかります。
ax = df['Y'].plot.hist()
df['Y'].plot.kde(grid=False, ax=ax.twinx());
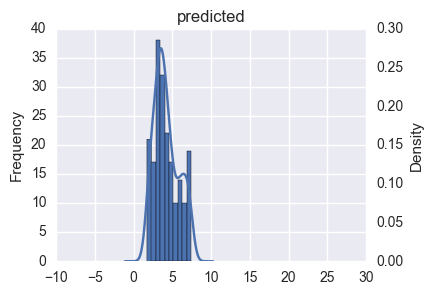
このような場合、重回帰をしても決定係数が低く、予測結果の分布も明らかに異なっています。
import pandas_ml as pdml
mdf = pdml.ModelFrame(df, target='Y')
lm = mdf.lm.LinearRegression()
mdf.fit(lm)
# LinearRegression(copy_X=True, fit_intercept=True, n_jobs=1, normalize=False)

# 決定係数
mdf.score(lm)
# 0.14312960776740502

# 切片, 回帰係数
lm.intercept_, lm.coef_
# (2.2039889528112147, array([-1.32283473,  2.65683543,  0.04619692]))

ax = predicted.plot.hist()
predicted.plot.kde(title='predicted', grid=False, ax=ax.twinx(), xlim=(-10, 30));
データの分布の確認
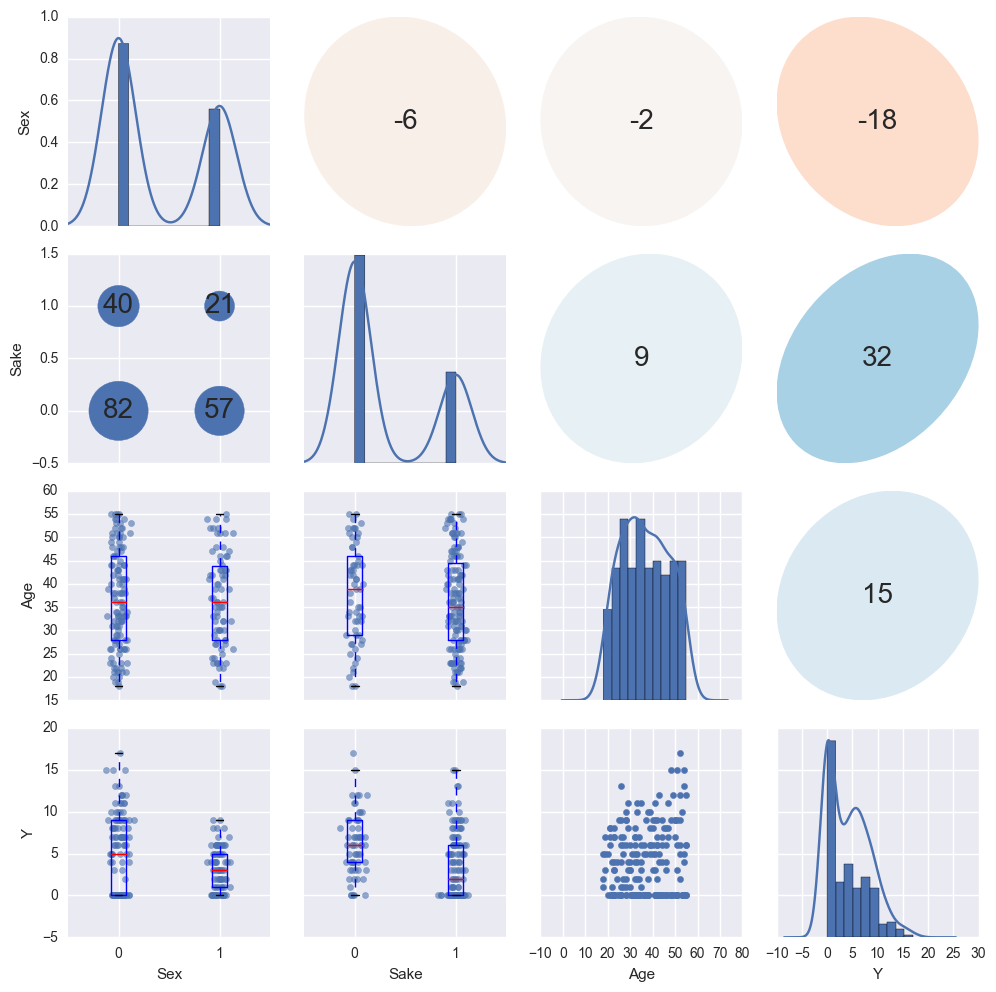
上で見たとおり、データはカテゴリ値 ( 離散値、Sex, Sake) と 連続値 ( Age, Y ) が混ざったデータとなっています。
R には {GGally} というパッケージがあり、値の種類に応じて散布図行列中のプロットを描きわけてくれます。
Python で似たようなことをするには、seaborn の PairGrid クラスを使うのが良いでしょう。PairGrid クラスは与えられたデータの散布図行列に必要なサブプロットを生成し、それぞれの成分に対して適当なプロット関数をまとめて適用することができます。
seaborn 標準では値の種類に応じたプロットの描きわけができないので、自作のプロット関数を用意します。設定変更を容易にするため、Dispatcher クラスとして作成しました。上三角部分は(ほぼ)松浦さんのブログのそのままです。
class Dispatcher(object):

    def __init__(self, fontsize=20, alpha=0.6, cmap='RdBu', threshold=10):
        self.fontsize = fontsize
        self.alpha = alpha
        self.cmap = plt.get_cmap(cmap)

        # 離散値 / 連続値とみなす閾値
        self.threshold = threshold

    def comb(self, x_series, y_series, label=None, color=None):
        """ 下三角部分のプロット """

        x_nunique = x_series.nunique()
        y_nunique = y_series.nunique()

        if x_nunique < self.threshold and y_nunique < self.threshold:
            # 離散値 x 離散値のプロット
            return self._dd_plot(x_series, y_series, label=label, color=color)

        elif x_nunique < self.threshold or y_nunique < self.threshold:
            # 離散値 x 連続値のプロット
             return self._dc_plot(x_series, y_series, label=label, color=color)

        else:
            # 連続値 x 連続値のプロット
            return plt.scatter(x_series, y_series, label=label, color=color)

    def _dd_plot(self, x_series, y_series, label=None, color=None):
        """ 離散値 x 離散値のプロット """

        # x, y 各組み合わせの個数を集計
        total = y_series.groupby([x_series, y_series]).count()

        # x, y軸をプロットする位置を取得
        xloc = total.index.labels[0]
        yloc = total.index.labels[1]
        values = total.values

        ax = plt.gca()
        for xp, yp, vp in zip(xloc, yloc, values):
            ax.annotate(vp, (xp, yp), fontsize=self.fontsize,
                        ha='center', va='center')

        # 組み合わせの個数を散布図としてプロット
        size = values / (values.max() * 1.1) * 100 * 20
        ax.scatter(xloc, yloc, s=size, label=label, color=color)
        ax.set_ylim(yloc[0] - 0.5, yloc[-1] + 0.5)

    def _dc_plot(self, x_series, y_series, label=None, color=None):
        """ 離散値 x 連続値のプロット """

        if y_series.nunique() < x_series.nunique():
            # y軸が離散値の場合は、x, yを入替
            # 水平方向に箱ひげ図をプロット
            x_series, y_series = y_series, x_series
            vert = False
        else:
            vert = True

        xlab, xun = pd.factorize(x_series)

        # 箱ひげ図用のデータの準備
        data = []
        for i, g in y_series.groupby(xlab):
            data.append(g)

        ax = plt.gca()
        ax.boxplot(data, positions=np.arange(len(data)), vert=vert)

        # 散布図をプロット
        xloc = xlab + np.random.normal(scale=0.05, size=len(xlab))
        if not vert:
            y_series, xloc = xloc, y_series

        ax.scatter(xloc, y_series, label=label, color=color,
                   alpha=self.alpha)

    def diag(self, series, label=None, color=None):
        """ 対角部分のプロット """

        ax = series.plot.hist()
        ax = series.plot.kde(grid=False, ax=ax.twinx())
        ax.yaxis.set_visible(False)

    def ellipse(self, x_series, y_series, label=None, color=None):
        """ 上三角部分のプロット """

        from matplotlib.patches import Ellipse

        # 相関係数を楕円としてプロット
        r = x_series.corr(y_series)
        c = self.cmap(0.5 * (r + 1))

        ax = plt.gca()
        ax.axis('off')
        ax.add_artist(Ellipse(xy=[.5, .5], width=np.sqrt(1 + r), height=np.sqrt(1 - r),
                              angle=45, facecolor=c, edgecolor='none', transform=ax.transAxes))
        ax.text(.5, .5, '{:.0f}'.format(r * 100), fontsize=self.fontsize,
                ha='center', va='center', transform=ax.transAxes)
作成したクラスを使ってプロットします。対角成分にはヒストグラムを描画する = y 軸が他と異なるため、PairGrid の作成時に
diag_sharey=False を指定します。
g = sns.PairGrid(df, diag_sharey=False)

d = Dispatcher()
# 対角成分
g.map_diag(d.diag)
# 下三角成分
g.map_lower(d.comb);
# 上三角成分
g.map_upper(d.ellipse);
Stanの実行
ここから、PyStan を使ってサンプリングを行います。
import pystan
pystan.__version__
# '2.12.0.0'
Age 列のスケールを変更し、切片に対応する列を挿入します。
df['Age'] = df['Age'] / 10
X = df[['Sex', 'Sake', 'Age']]
X.insert(0, 'Intercept', 1)
X
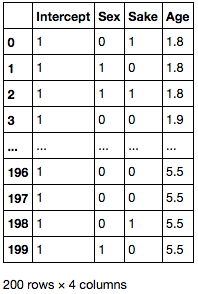
PyStan でサンプリングを実施します。書籍とは添字や表示順序が異なります。
stanmodel = pystan.StanModel(file='model/model11-7.stan')
# INFO:pystan:COMPILING THE C++ CODE FOR MODEL anon_model_f3132948938ed3766129342e203c72d6 NOW.

data = {'N': X.shape[0], 'D': X.shape[1], 'X': X.values, 'Y': df['Y'].values}

fit = stanmodel.sampling(data=data, pars=['b', 'q', 'lambda'], seed=123)
fit
# Inference for Stan model: anon_model_f3132948938ed3766129342e203c72d6.
# 4 chains, each with iter=2000; warmup=1000; thin=1;
# post-warmup draws per chain=1000, total post-warmup draws=4000.
#
#               mean se_mean     sd   2.5%    25%    50%    75%  97.5%  n_eff   Rhat
# b[0,0]        0.95    0.01   0.66  -0.37   0.51   0.95   1.39   2.27   2434    1.0
# b[1,0]        1.45  2.9e-3   0.13    1.2   1.36   1.44   1.54    1.7   2080    1.0
# b[0,1]        1.61  7.7e-3   0.42   0.82   1.32    1.6   1.89   2.46   2978    1.0
# b[1,1]       -0.75  1.4e-3   0.08   -0.9   -0.8  -0.75  -0.69   -0.6   3159    1.0
# b[0,2]        3.36    0.02   0.86   2.01   2.78   3.24   3.81    5.3   1647    1.0
# b[1,2]       -0.16  1.4e-3   0.07  -0.31  -0.21  -0.16  -0.11  -0.02   2648    1.0
# b[0,3]       -0.37  3.6e-3   0.17  -0.72  -0.49  -0.37  -0.25  -0.03   2355    1.0
# b[1,3]         0.2  7.4e-4   0.03   0.13   0.18    0.2   0.22   0.26   2020    1.0
# ... 略 ...
q と lambda の順位相関係数の信用区間を求めます。サンプルごとに相関係数を求め、分位点を取ればよいです。
samples = fit.extract()

from scipy import stats
r = [stats.spearmanr(x, y)[0] for x, y in zip(samples['q'], samples['lambda'])]
np.percentile(r, q=[2.5, 25, 50, 75, 97.5])
# array([-0.80461466, -0.6961319 , -0.64964589, -0.6052952 , -0.47924492])
まとめ
- 「StanとRでベイズ統計モデリング」11章3節を
PyStanでやってみました RStanとPyStanで大きな機能差はないので、前処理 / 後処理 (プロット) に慣れている言語を使えばいいと思います- 書名は "StanとRで..." となっていますが、複雑な
Rコードは出てきません (本エントリの "Stanで実行" 部分がわかれば読める程度です)。そのため、統計モデリングに興味があるPythonユーザにもおすすめです

StanとRでベイズ統計モデリング (Wonderful R)
- 作者: 松浦健太郎,石田基広
- 出版社/メーカー: 共立出版
- 発売日: 2016/10/25
- メディア: 単行本
- この商品を含むブログ (4件) を見る