R ggplot2 で monthplot
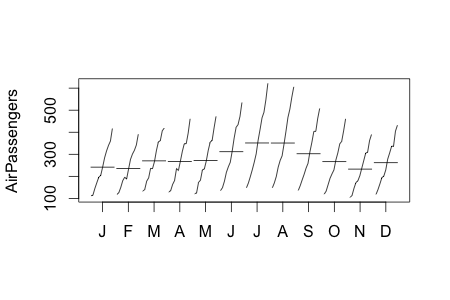
Rで時系列データの周期特性をちゃっと確認したいとき、monthplotという関数を使うとデータを月次に分割してグラフ作成してくれる。
monthplot(AirPassengers)

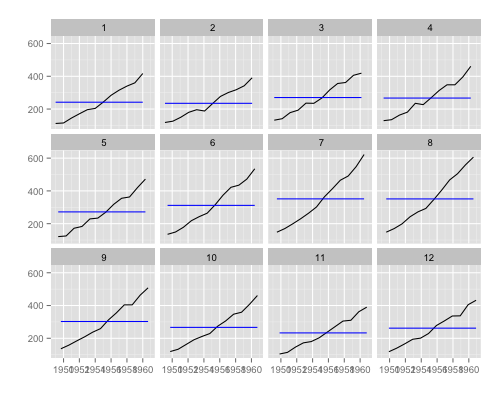
が、出力がちょっとアレなのと 月次以外の周期性をみたい場合があるので、 ggplot2 で作ってみた。
library(devtools)
install_github('sinhrks/ggfortify')
library(ggfortify)

ggfreqplot(AirPassengers)

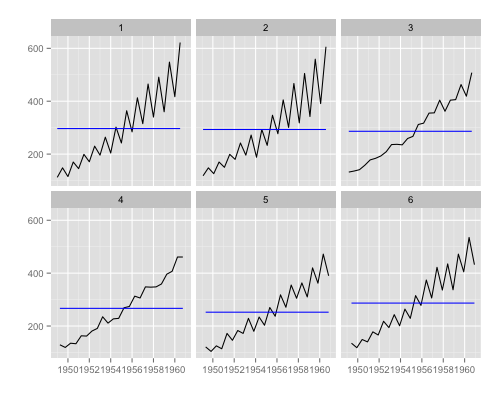
6ヶ月ごとの周期をみたいとき。
ggfreqplot(AirPassengers, freq = 6)

RPubs - Plotting Time Series Statistics with ggplot2 and ggfortify

Rグラフィックスクックブック ―ggplot2によるグラフ作成のレシピ集
- 作者: Winston Chang,石井弓美子,河内崇,瀬戸山雅人,古畠敦
- 出版社/メーカー: オライリージャパン
- 発売日: 2013/11/30
- メディア: 大型本
- この商品を含むブログ (2件) を見る